
EBSD Explained
Techniques
Applications
Hints and Tips
Technology
OXFORD INSTRUMENTS EBSD PRODUCTS
CMOS Detector RangeAZtecHKL Acquisition SoftwareAZtecCrystal Processing Software
The Electron Backscatter Diffraction (EBSD) technique is, in general, very good at differentiating between phases with different crystallographic structures. This makes it very powerful in many routine applications, such as mapping ferrite (BCC) and austenite (FCC) in duplex steels, or distinguishing between alpha-Ti (HCP) and beta-Ti (BCC). However, it is a challenge to use EBSD to differentiate between phases with similar crystal structures, as the standard Hough-based indexing approach uses the angles between the Kikuchi bands (and hence the lattice planes) and thus will struggle to identify correctly multiple phases with the same structure. Common applications where this may be a problem include samples from electronic packaging components (that often include multiple FCC metals, including Cu, Ni and Ag), some geological minerals (such as the tetragonal minerals zircon and rutile) and the phases present in martensitic and bainitic steels (e.g. ferrite, martensite and bainite, all indexable using a BCC structure).
Emerging indexing approaches, such as dictionary indexing or spherical indexing, will be more robust in these applications (although with significant analytical time penalties) and even the use of the AZtecHKL Refined Accuracy band detection approach will improve the efficacy of live phase discrimination. However, there are a number of highly effective, alternative strategies that can be employed to provide a more advanced phase discrimination with minimal impact on the speed of analysis. These include:
For each of these approaches, the following tabs provide details of the processes and show application examples.
EBSD systems are frequently integrated with EDS systems, enabling the simultaneous measurement of both the chemical and the crystallographic information from the sample. In order for this to be possible, the analytical geometry must be correct. This means that the sample must be positioned in a geometry where the EBSD detector can acquire good quality diffraction patterns, and the EDS detector can simultaneously measure a sufficiently high number of X-ray counts. The image shows the ideal geometry for integrated EBSD and EDS, with the EDS detector mounted above the EBSD detector and with a clear line of sight to the sample.
If the sample needs to be positioned at a longer working distance (WD), then this can cause the EBSD detector to occlude the EDS detector, preventing sufficient X-ray signal. In this case, moving the detector downwards (e.g. via the elevation control in the Symmetry S3 detector) will resolve the issue. However, for very long working distances (i.e. with the sample positioned many mm lower than the optimum analytical WD), it may be necessary to partially retract the EDS detector to maintain a sufficient X-ray signal.
Assuming that a good simultaneous X-ray signal can be collected, this can be used to assist in the phase discrimination during EBSD mapping. The process (referred to in AZtec as “TruPhase”) follows these steps:

Ideal geometry for integrated EBSD and EDS analyses.
This process has minimal impact on the speed of analysis and, since spectrum matching rather than quantitative analysis is carried out, the algorithm is robust even when live EDS spectra only have a low number of X-rays (e.g. <100 total X-rays).
In the following application example of EDS-assisted indexing, TruPhase has been used to discriminate effectively between multiple face centred cubic (FCC) phases in a Ni superalloy. The phases in question are shown in the table:
Phase |
Space Group |
Unit Cell parameters |
Ni |
225 (cubic) |
a = 3.57Å |
Ni3Nb |
59 (orthorhombic) |
a = 5.12Å, b = 4.26Å, c = 4.57Å |
Nb carbide |
225 (cubic) |
a = 4.46Å |
Ti nitride |
225 (cubic) |
a = 4.24Å |
Although the difference in unit cell parameters between the 3 FCC phases may be resolvable based on the Kikuchi band widths using very high resolution EBSD patterns (see the next tab – Kikuchi band width assisted indexing), the chemical differences are far more pronounced. This is shown in the following EDS data, showing the distribution of Ni, Ti and Nb using the relevant element maps.

EDS element maps highlighting the presence of Nb and Ti rich carbide phases
If indexing was carried out using a standard Hough transform approach, with no use of chemical data, we can see that all the cubic phases can be indexed using the standard Ni superalloy structure, with only the orthorhombic Ni3Nb phase effectively discriminated. This is shown in the following EBSD phase map (on the left):

Ni superalloy phase map without the use of chemical data, showing that all cubic phases are matched to the FCC Ni-superalloy structure.

Ni-superalloy phase map using TruPhase chemistry-assisted indexing. Note the effective discrimination of the 3 FCC phases.
However, if reference spectra are collected from each of the FCC phases, and Truphase is used to assist the indexing process, then it is clear from the phase map (above right) that effective discrimination of the phases is achieved.
The one drawback of chemistry-assisted indexing is that the spatial resolution of simultaneous EDS measurements is constrained by the electron-sample interaction volume and the associated X-ray source volume. On many materials, at 20 kV beam energy, this will be on the order of 1 um diameter, making the separation of phases on the sub-um scale particularly challenging. Solutions can involve the reduction of the beam energy, or the use of post-acquisition data filtering.
Phases that share the same crystal structure (e.g. space group) will have the crystallographic zone axes and the Kikuchi bands in the same positions in their respective EBSD patterns. However, the widths of the Kikuchi bands in the EBSD pattern will be inversely related to the d-spacing of the corresponding lattice plane in the phase and, as such, we can use the Kikuchi band widths to discriminate between phases with the same structure but differing unit cell dimensions.
The effectiveness of this approach will be in part limited to the resolution of the diffraction patterns. In a low-resolution pattern collected at high acquisition speeds, an individual Kikuchi band will typically only be 5-10 pixels across, and this means a 10% difference in d-spacing would involve a sub-pixel difference in band width. In the example below, a 156x128 pixel resolution EBSP from an austenite grain (FCC Fe) can equally well be indexed as Fe-FCC or as Al. Both structures are space group 225, with ~10% difference in the unit cell lengths.
 grain")
Typical high speed, low resolution EBSP from FCC-Fe
 grain with an overlay of the correct solution")
EBSP indexed as FCC-Fe
 grain showing incorrect indexing as Al")
Same EBSP indexed as Al
In this particular example, the use of Kikuchi band widths is only going to be of limited effectiveness, unless the difference between the unit cell dimensions is significantly larger (e.g. >30%). However, if higher resolution EBSPs are collected, then the use of band widths can be a very effective discriminator between phases with the same structure. In the following example, a sample with a Pt-Ni interface has been analysed using AZtecHKL. The 2 phases have been grouped, so that the indexing software will consider the Kikuchi band widths as a discriminator during the indexing process. Higher resolution EBSPs ensure that, even though there is only just >10% difference between the unit cell lengths (see table), the phase separation is effective. This is shown in the phase maps below, showing the indexing without and with the band width information, and corresponding Pt and Ni element maps to confirm the results.
Pt |
Ni |
cubic |
cubic |
fcc |
fcc |
3.92 |
3.52 |
space group = 225 |
space group = 225 |
Table showing the respective unit cell details for Pt and Ni. Note ~10% difference in unit cell dimensions.
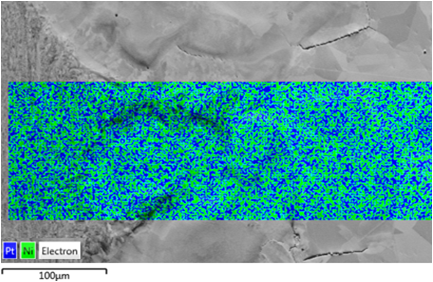
Phase map of a Pt-Ni mixing zone using conventional EBSD indexing.
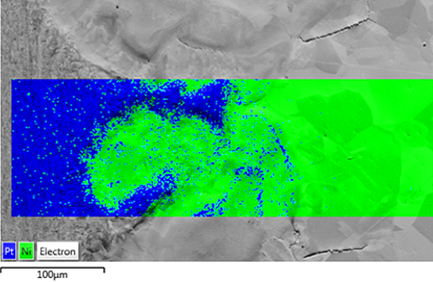
Phase map of a Pt-Ni mixing zone collected using Kikuchi-band width assisted indexing in AZtec.
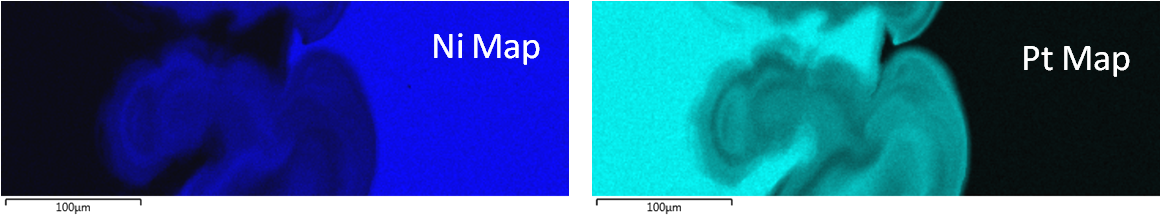
Ni and Pt EDS X-ray maps of the same area
Although the Pt-Ni example shown above could have utilised EDS-assisted indexing to discriminate between the phases, in some microstructures the scale of features is too small for the effective use of X-ray information. EBSD has a significantly higher spatial resolution than EDS, and hence discriminating between similar phases by Kikuchi band widths can be more effective than the use of chemical information from EDS.
In some cases, it may be impossible to differentiate between phases during conventional live EBSD data acquisition. This is the case in some steels, in which a number of phases (e.g. ferrite, bainite and martensite) are usually indexed using the same phase structure. Although there is recent research that indicates that EBSD pattern matching techniques can discriminate between slight c/a unit cell variations in martensite (e.g. Winkelmann et al., Physical Review Materials 2, 123803 (2018)), this is not possible using standard Hough-transform based indexing.
However, the variations in the structures on the lattice scale (such as the lattice distortion caused by increased C in martensite) can result in notable differences in other parameters measurable by EBSD. This includes the pattern quality, the size and shape of grains and the distribution of strain in the microstructure; all of these can be used during data processing to assist in the reclassification of phases.
In AZtecHKL Data Analysis and in AZtecCrystal, we have developed a phase reclassification tool that is based on user-trained machine learning. The principle is quite simple and follows these steps:
The process by which the classification is carried out is more complex. Once the parameters have been selected, the software creates an n-dimensional parameter space, where each cell represents a unique combination of the parameter values. When the user trains the system, each selected pixel in a map will be assigned to a particular class, and the corresponding cell in parameter space will be given a vote for that class. Individual cells can have votes for multiple classes, but the class with the most votes is assigned to that cell. The software then uses a nearest-neighbour algorithm to fill in the empty cells in the parameter space, this creating a class look-up table (LUT). This LUT is then used to classify the whole of the EBSD map. The process is summarised in the following image, using an example with 3 classes but just 2 parameters:
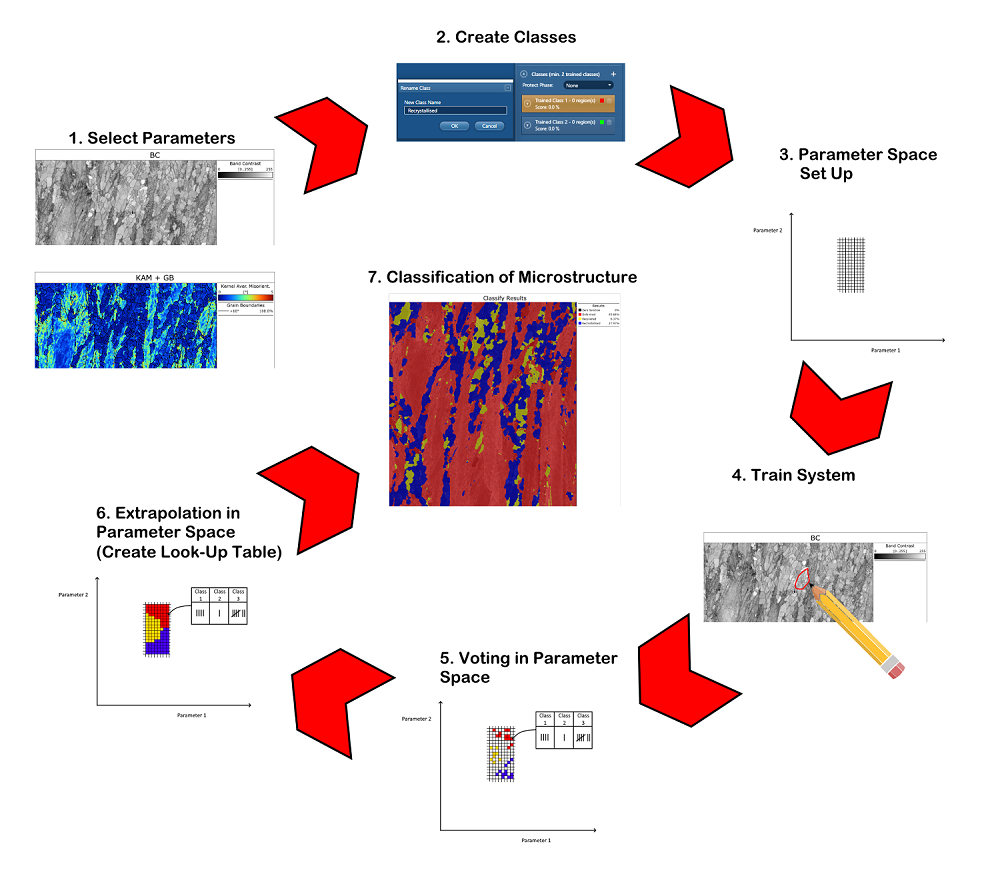
Schematic figure showing the process of machine learning in the AZtecCrystal Classification Tool.
This process is extremely effective in the classification of many different microstructures and is far more robust than conventional thresholding approaches. In some examples, only minimal training is required in order to obtain effective discrimination of the classes, whereas in more complex cases multiple training areas are required. The most common applications are for the separation of martensite and ferrite in steels, and for distinguishing between deformed, recovered and recrystallised grains in deformed and heat-treated materials.
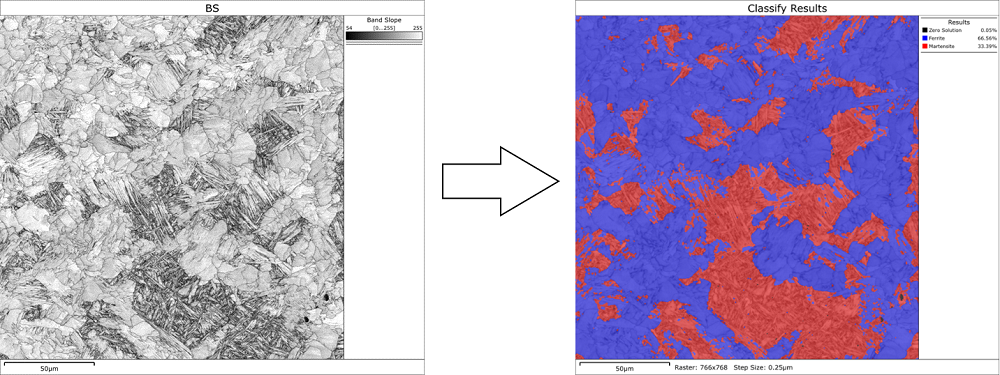
Example phase classification of a ferrite-martensite microstructure. Left: band slope EBSP quality map, with martensite characterised by the darker shades (due to poorer Kikuchi band sharpness). Right: results of phase classification in AZtecCrystal, based on EBSP quality and Kernel Average Misorientation parameters. Ferrite is shown in blue, martensite in red.
© Oxford Instruments 2026